
Imagine having full control over your home’s energy use right at your fingertips. With a smart home energy dashboard, you can see exactly where your power is going, spot waste, and save money without lifting a finger.
If you want to make your home smarter and your bills smaller, this article will give you fresh ideas to create a dashboard that works perfectly for you. Keep reading to discover simple, effective ways to take charge of your energy and transform your living space.

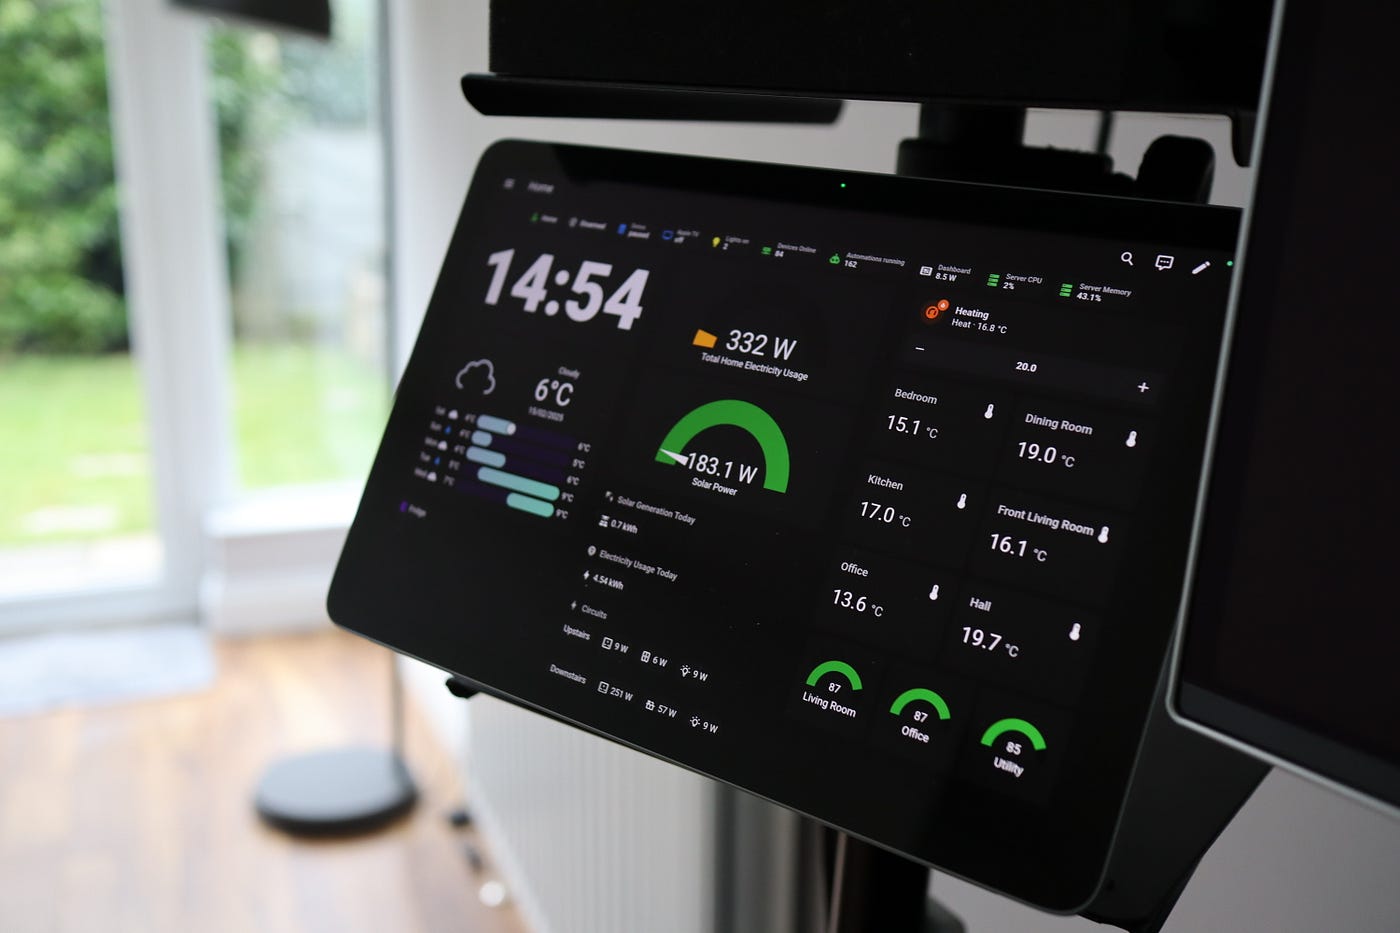
Credit: www.reddit.com
Benefits Of Smart Home Energy Dashboards
Smart home energy dashboards show how much power you use at any time. They help you understand your energy habits and costs.
These dashboards make it easier to save energy and reduce your bills. They give clear information about your home’s energy use.
Tracking Real-time Energy Use
Smart dashboards show energy use as it happens. You can see which devices use the most power right now.
This helps you control your energy use throughout the day. You can turn off devices that waste power instantly.
Identifying Energy Waste
The dashboard helps find where energy is wasted. It shows patterns and times when power use is too high.
You can spot devices that use energy even when not needed. This helps you fix problems and cut waste.
- Detect appliances left on by mistake
- See standby power use by devices
- Find leaks in heating or cooling
Enhancing Appliance Efficiency
Smart dashboards give tips to improve appliance use. They suggest the best times to run devices for less energy.
You can track if appliances work well or need repair. This keeps your home energy use low and efficient.
- Schedule appliances for off-peak hours
- Monitor energy use for each device
- Check appliance performance regularly
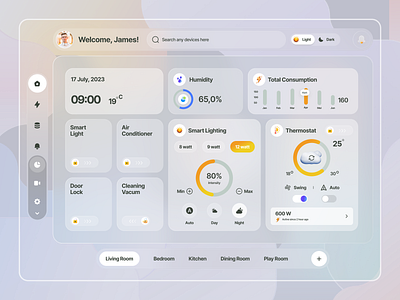
Credit: dribbble.com
Key Features To Include
A smart home energy dashboard helps you track and manage your energy use. It shows real-time data and helps save energy.
Good dashboards have features that make them easy to use and useful. Let’s look at key features to include.
User-friendly Interface
The dashboard should be simple and clear. Users must find information quickly without confusion.
Use easy icons, readable fonts, and clear layouts. A clean design helps users focus on their energy data.
- Simple navigation menus
- Clear labels and icons
- Responsive design for phones and tablets
- Use of colors to show energy levels
Customizable Alerts
Alerts notify users about unusual energy use or high consumption. Users should set alerts based on their needs.
Alerts can come as notifications, emails, or texts. Custom alerts help users act fast to save energy.
- Set alert thresholds for energy use
- Choose alert types: sound, email, or app
- Schedule alerts for certain times
- Alert history to track past notifications
Integration With Smart Devices
The dashboard should connect to smart meters, thermostats, and appliances. This gives a full picture of energy use.
Integration allows automatic data updates and remote control of devices. It helps users manage energy better.
- Support for popular smart home brands
- Real-time syncing with devices
- Control smart devices from the dashboard
- Easy setup and connection process
Historical Data And Trends
Showing past energy use helps users understand patterns. They can spot times of high or low consumption.
Graphs and charts make trends easy to see. Users can compare days, weeks, or months.
- Daily, weekly, and monthly views
- Compare current and past periods
- Visual charts like line or bar graphs
- Download data for further analysis
Creative Dashboard Design Ideas
Smart home energy dashboards show energy use in easy ways. Good design helps users save energy and money.
Creative ideas make dashboards fun and simple to understand. These ideas help people control their energy better.
Visual Energy Maps
Visual energy maps show energy use in different rooms. They use colors or icons to highlight high or low usage areas.
This helps users see where energy is wasted. They can focus on saving energy in specific spots.
- Use colors like red for high use and green for low use
- Show real-time data for instant feedback
- Include icons for appliances or devices
- Allow zooming to see details in each room
Interactive Usage Graphs
Interactive graphs let users explore their energy use over time. They can select days, weeks, or months to compare data.
Users can click on graph points to see details. This helps them understand patterns and find ways to save energy.
- Use line or bar charts for clear display
- Include filters for different devices or rooms
- Show peak hours and low usage periods
- Use tooltips for extra information on hover
Gamification For Savings
Gamification adds fun by rewarding energy savings. Users can earn points or badges for reducing use.
Challenges and goals motivate users to save more energy daily. This keeps them engaged and aware.
- Set daily or weekly energy-saving goals
- Reward badges for milestones reached
- Include leaderboards to compare with family or neighbors
- Use progress bars to show savings progress
Voice Control Integration
Voice control lets users check energy data hands-free. They can ask for current use or tips to save energy.
It makes the dashboard more accessible for all ages. Users can control devices or settings by voice commands.
- Allow voice queries about energy consumption
- Enable voice commands to turn off devices
- Integrate with popular voice assistants
- Provide spoken feedback on energy goals
Top Energy Metrics To Monitor
Smart home energy dashboards show important information about your energy use. They help you understand how much energy you use and when.
Tracking key metrics lets you save money and reduce waste. Here are some top energy metrics to watch closely.
Daily And Monthly Consumption
Check how much energy your home uses every day and month. This helps you see patterns and spot high usage days.
Daily data shows short-term use. Monthly data shows long-term trends.
- Daily consumption in kilowatt-hours (kWh)
- Monthly total energy use
- Compare current month to last month
- View average daily use each month
Peak Usage Times
Identify hours when your energy use is highest. Peak times can increase your electricity bill.
Knowing peak hours helps you shift some energy use to cheaper times.
- Record hourly energy use
- Find daily peak hours
- Track peak days in a month
- Plan to reduce use during peak times
Carbon Footprint Estimates
Estimate how much carbon dioxide your energy use creates. This shows your home’s impact on the environment.
Lowering your carbon footprint helps fight climate change.
- Calculate CO2 emissions from kWh used
- Compare emissions month to month
- Track reductions from energy saving efforts
Cost Savings Calculations
See how much money you save by using less energy. Cost data shows real benefits of energy tracking.
Use this metric to decide if changes in energy use are helpful.
- Calculate daily and monthly energy cost
- Compare current costs to past periods
- Estimate savings from lower energy use
- Include varying electricity rates if applicable
Tips To Maximize Savings
A smart home energy dashboard helps you track and control your energy use. It shows where you can save money by using less power.
Follow these tips to use your energy dashboard well. They help lower your bills and reduce waste.
Setting Energy Budgets
Set clear energy limits for your home. This helps you avoid using too much electricity each month.
Track your daily and weekly energy use. Adjust your habits if you go over budget.
- Decide how much energy to use each day
- Watch your dashboard for alerts
- Change settings to stay under budget
Automating Energy-saving Actions
Use your dashboard to set automatic actions that save energy. This reduces the need to do it manually.
For example, turn off lights or lower heating when rooms are empty.
- Set lights to switch off when not in use
- Adjust thermostat automatically at night
- Turn off appliances during low-use hours
Scheduling Appliance Use
Plan when to run big appliances like washers and dryers. Use times with lower energy costs.
Many dashboards let you schedule these appliances to run at night or weekends.
- Run dishwashers during off-peak hours
- Use washing machines late at night
- Schedule water heaters for early morning use
Seasonal Adjustments
Change your energy settings based on the season. Heating and cooling needs vary throughout the year.
Adjust your dashboard to reflect these changes and save energy all year.
- Lower heating settings in spring and fall
- Use fans more in summer to reduce air conditioning
- Set timers for holiday lighting only when needed
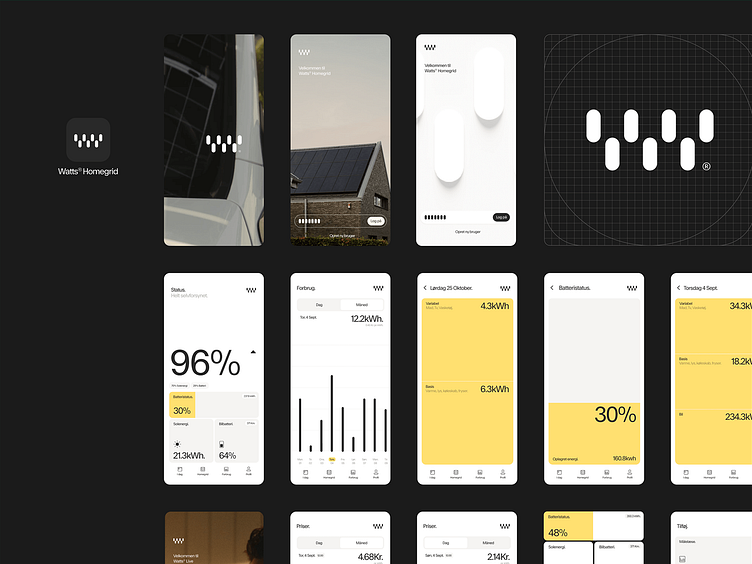
Credit: dribbble.com
Popular Tools And Platforms
Smart home energy dashboards help track and manage energy use. They show data in easy-to-understand formats.
Many tools and platforms offer different features. You can choose one based on your needs and devices.
Standalone Dashboard Apps
Standalone dashboard apps run on phones, tablets, or computers. They collect data from smart meters or sensors.
These apps display graphs and charts to help users see energy use trends. Some apps also give tips to save energy.
- Easy to install and use
- Works with many devices
- Offers real-time energy data
- May include alerts and reports
Smart Home Hub Integrations
Smart home hubs connect many devices in one system. They can include energy dashboards as part of their apps.
These platforms collect data from smart plugs, lights, and thermostats. They show energy use and help control devices remotely.
- Centralized control for many devices
- Energy data combined with automation
- Supports popular hubs like Google Home and Amazon Alexa
- Can trigger actions based on energy use
Open-source Solutions
Open-source energy dashboards let users customize their setup. They offer more control over data and features.
These solutions often require some technical skill to install and run. They work well for users who want flexible options.
- Free to use and modify
- Community-driven development
- Supports various hardware and sensors
- Good for advanced users and hobbyists
Future Trends In Smart Energy Dashboards
Smart energy dashboards help people track and manage their home energy use. These tools are changing with new technology.
Future trends will make these dashboards smarter and easier to use. They will offer better insights and help save energy.
Ai-powered Recommendations
Artificial intelligence can learn your energy habits. It suggests ways to save energy based on your behavior.
AI can predict high energy use times and offer tips to reduce waste. This helps lower energy bills and carbon footprints.
- Personalized energy-saving tips
- Automatic adjustments for devices
- Real-time alerts for unusual usage
Enhanced Renewable Energy Tracking
Smart dashboards will show detailed info about solar and wind energy use. Users can see how much clean energy they produce and use.
This helps homeowners understand their renewable energy impact. It also supports better decisions on energy storage and sharing.
- Real-time solar panel output
- Battery charge and discharge data
- Carbon savings from renewables
Community Energy Sharing
Future dashboards may connect neighbors to share energy. People with extra solar power can send it to others in their community.
This sharing lowers overall energy costs and supports local grids. Dashboards will track shared energy and credits earned.
- Track energy sent and received
- Manage energy credits and balances
- Support local energy networks
Frequently Asked Questions
What Is A Smart Home Energy Dashboard?
A smart home energy dashboard displays real-time energy usage data. It helps monitor, analyze, and optimize electricity consumption efficiently. Users can track usage trends and identify saving opportunities. This tool improves energy management and reduces utility bills effectively.
How Do Smart Energy Dashboards Save Money?
Smart energy dashboards highlight high energy consumption areas. They suggest usage adjustments to reduce waste. By tracking patterns, users can shift usage to off-peak times. This leads to lower energy bills and better cost efficiency over time.
Which Devices Integrate With Smart Energy Dashboards?
Smart energy dashboards integrate with smart meters, thermostats, and appliances. They collect data from solar panels and battery storage systems. This integration provides a comprehensive view of home energy flow. It enhances control and automation for energy savings.
Can Smart Dashboards Track Renewable Energy Usage?
Yes, smart dashboards monitor renewable energy generation and consumption. They display solar panel output and battery charge levels. This helps optimize renewable energy use and reduces reliance on the grid. Users can maximize clean energy benefits easily.
Conclusion
Smart home energy dashboards simplify energy management. They offer clear insights and control. Save money and reduce your carbon footprint effortlessly. With the right dashboard, monitor energy use easily. Customizable features help in personalizing your experience. Enhance your home’s efficiency without complexity.
Consider design and functionality when choosing a dashboard. Stay informed and make smart energy choices daily. Embrace technology to improve your lifestyle. Achieve sustainable living with minimal effort. Smart dashboards make managing energy intuitive. Enjoy the peace of mind that comes with energy awareness.
Start exploring these ideas today for a smarter home.
22 min read